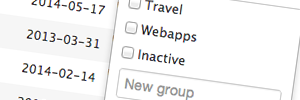
Create groups of websites
To make it easier for you to handle a large number of sites you can group them together and view their combined statistics. When you start out there is a default group called "All websites" that shows data for all your sites, but you can create as many groups as you need and a site may belong to many groups.
The point of creating groups is that you can treat them a bit like investment portfolios. Group them by subject, target audience, language or type for example. Compare groups to find successful strategies, sites that needs more work and what you should prioritize.
Everything in one place
We start with data from Google Analytics and automatically add information from dozens of other sources. A few of the things you will find:
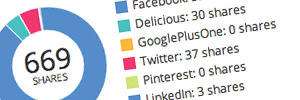
- The number of times people share your startpage on social networks like Facebook, Twitter, Google Plus, Pintrest and LinkedIn.
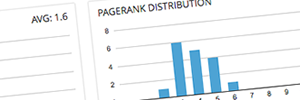
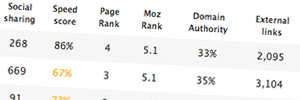
- SEO data like PageRank, MozRank, Domain Authority, Page Authority and number of links to the site.
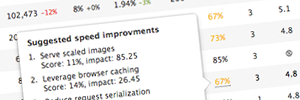
- How optimized your sites are for quick loading. You will see a total score and a prioritized list of suggested improvments for all sites.
- Your domain names - when they were registered, when they expire, what company they are registered with and details about dns servers and ip-numbers.
Most of this is also available for your groups of sites, as totals or averages.
View all social interactions
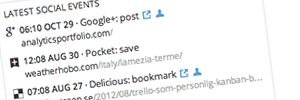
Follow how people interact with your sites. The dashboard shows every mention of your site on over 400 social networks like Google+, Quora, Delicious or Disqus and ordinary blogs.
See what page was shared, who it was that shared and go directly to the relevant pages.
Long term trends
We take your data from Google Analytics and present it in a way that focuses on long term performance and comparison between sites. See monthly figures and the linear regression trend for two years back with each month compared to the same month one year ago.

Streamlined workflow
We try to adapt the workflow so you quickly can get an overview over hundreds of sites, but go directly to the sources for in depth information when you need it.
Your data is safe
We use 256-bit AES encryption for all communication and use Google's official permission system to connect your account.
To protect your data we remove all traces of a website if you deactivate it or close your account.